Wednesday, May 7, 2014

Measuring Video Blink Rate with an Arduino

In my previous post, I used blinking videos on my computer to entrain my brain waves.  A key question, though, was whether my computer could play those blinking videos steadily.  If the blinking isn't steady, it won't entrain brainwaves that are easily detected.  So, in this new post, I show how I hacked a photocell and my Arduino to measure the blink rate that my computer is actually producing.  It's a pretty simple (and cheap!) setup and, as you'll see below, its data explains some of the important findings in my EEG data!

Measuring the Blink Rate From the Movies Played Back by my Computer

Using a Photocell:  My approach to measuring the video blink rate is to quickly and continuously measure the light produced by my computer screen.  I chose to use a photocell, mostly because I had one that came with my very first Arduino.  To learn how to use a photocell, I followed the tutorial at Adafruit.  It explains what a photocell is and it explains exactly how to hook it up to an Arduino.  The key is that you connect a photocell and a 10K resistor in series.  Together, they form a voltage divider.  Then, you connect one end to +5V and the other end to ground.  In the middle, at the junction between the photocell and the 10K resistor, you connect that point to the Arduino's analog input pin.  Pretty easy!

Wiring It Up:  To connect all of the bits together, I needed to solder a few things.  First, I gathered my components -- the photocell, some wire, and some shrink tube (to keep the soldered wires from shorting to each other).

The Components: A Super-Cheap Photocell, some Wire,
and some Shrink Tube.  The 10K resistor is not shown.

Then, I soldered the wires to the legs of the photocell and insulated them with the shink tube.  The photo below shows the components after this assembly.  Looks decent enough.

Fully Assembled.  This is the first version that I tried.  Notice that the back
and sides of the photocell are exposed.  This turned out to be bad.

Unfortunately, when I hooked it up to my Arduino, I found that I was not seeing any change in the light level from my computer screen.  After some playing around, I found that the photocell is sensitive to light from the back and sides, in addition to being sensitive to light from the front.  So, as seen in the photo below, I added another layer of shrink tube to block out the light entering from the back and sides.

Modified Assembly.  I added more shrink tube to wrap around the sides
back of the photocell.  You have to keep out that light!

Mounting Everything:  Once I had my photocell on those long(ish) lead wires, I connected it to the Arduino as discussed on the Adafruit site.  I then needed a way to hold the photocell close to the computer screen so that I could measure its blink rate.  As shown in the photo below, I found that my adjustable soldering fixture (sometimes called a "3rd Hand" fixture) works really well.  It works best if you position the photocell to be VERY close to the computer screen.

I held the photocell to the computer screen using a"3rd Hand" soldering fixture.
To record the photocell signal, I used one of the Analog Inputs available on the
Arduino that is the host for m OpenBCI shield.

Position the photocell to be VERY close to the screen.

Arduino Software:  If I'm going to use my Arduino to read the photocell, I need to some software for the Arduino.  My first step was to use the built-in Arduino example called "AnalogInOutSerial".  I then extended this program to report the actual resistance of the photocell under different lighting conditions ("ReadPhotocellResistance").  While either of these programs works fine to read the photocell, neither is clocked to read the values a steady pace.  If the sampling isn't steady, there's no way to know if the video blinking istelf is steady.  To fix this, you need to setup an Arduino timer.  Or, you could...

Integrate with OpenBCI:  The OpenBCI shield generates data packets at a very precise rate (I usually configure mine to sample at 250 Hz).  It could act as the clock to drive the Arduino to sample the photocell steadily.  So, I modified the OpenBCI Arduino sketch to read one of the analog input pins every time that it receives data from the OpenBCI shield.  It then appends this extra data value to the OpenBCI data packet and sends it to the PC.  Finally, I modified my OpenBCI GUI to receive the extra data and to include it in its log file.

Results:  I used this system to record the blinking produced by the blinking movies from my previous post.  Each movie was about 20 seconds long and each movie blinked at a different rate.  The digitized Photocell values are shown in the figure below as raw counts from the Arduino.  Clearly, this graph is a bit too zoomed out to see much of interest (though you can see the non-steady amplitude when at the fastest speed on the right).  We need to zoom in to see more detail...

Sample values recorded from the photocell by the Arduino's analog input pin. I played
my 10 whole-screen-blinking movies.  Each movie is about 20 seconds long.  Each movie
has a different blink rate -- from a 1 Hz white-to-white blink rate up to a 10 Hz w-w rate.

Zooming-In:  Excerpts from three of the movies are shown below.  In these plots, you can see that the light pulses recorded during the  3 Hz and 10 Hz movies look to be steadily paced, whereas the pulses in the 7 Hz movie looks much more irregular.  Based on this qualitative view, I'd say that the irregularity of the 7Hz movie might cause complications when used for EEG experiments.

Zoomed-In waveforms recorded from the photocell during my blinking movies.  Excerpts at three
different blink rates are shown.  The red and blue dots show features that I used to quantify each
movie's blink rate.  Note that the time scale is different for each of the movies so that you always
see 4 periods, despite their increasing speed.

Measuring the Blink Rate:  To better assess the steadiness of each movie, I setup a routine to quantify the blink rate on a blink-by-blink basis.  I did this by, first, computing the mean sensor value for the whole recording.  This is my threshold for deciding whether the screen is "white" or "black".  This threshold value is shown by the horizontal black line in the excerpts above.  Then, I detected when the signal crossed this threshold.  Each threshold crossing is shown as a blue dot in the figures above.  To compute the blink rate, I compute the difference between the dots.  The "white-to-white" blink rate is the difference between the red dots.  Alternatively, the rate at which the screen merely changed (either from white-to-black or black-to-white), I measured the difference between the blue dots.

Blink Rate Throughout the Test:  The plot below shows the results of quantifying the blink rate throughout the test.  In red, the plot shows the white-to-white blink rate.  In blue, I show the blink rate from both transitions.  As expected, the blink rate counting both transitions is twice as fast as the blink rate when counting just from white-to-white.

Blink Rate Measured for my 10 Movies.  The measured blink rate generally follows the expected blink
rate, though the measured blink rate exhibits unsteadiness at the faster speeds. The blink rate when
counting both transitions (whit-to-black and black-to-white) is especially unsteady at the higher speeds.

Unsteadiness:  As can be seen in the plot above, the blink rate is pretty steady for the first four movies (ie, speeds of 1-4 Hz W-W).  For the 5th movie (5 Hz W-W), the plot above starts to look messier, especially the blue line.  This means that the system is not playing back the blinking movie smoothly.  As we get into the faster movies (6-9) Hz, the blue line gets extremely messy.  Clearly, the system is unable to keep a steady pace of white-to-black and black-to-white transitions (the blue line), though the white-to-white period (the red line) isn't too as bad.  Funnily, at 10 Hz, note that the white-to-white blink rate gets very stable again.  It seems that at 10 Hz, the individual movie frames must be well-aligned with the natural update rate of the video system on my computer.

Relationship to EEG Data:  The whole purpose of this investigation was to see if my EEG results from my previous post (copied again below, for convenience) were reflecting properties of my brain, or if they were reflecting artifacts from imperfections in my computer's movie playback.  My main question with my EEG data is why I exhibited no video-entrained EEG signals above 10 Hz.  Well, looking at the graph of the computer's blink rate (above), we see that the video blink rate becomes extremely unstable for any frequency above 10 Hz.  My computer, in other words, was unable to generate steady visual stimulation above 10 Hz.  Without stable stimulation, my brain had nothing to entrain with.  Therefore, these limitations in my video system mean that I cannot declare either way whether my brain can entrain with visual stimuli at speeds greater than 10 Hz.  With a more stable video system, maybe I could entrain with the faster blinks.

EEG data shown in my previous post.  This is the signal recorded from the back of my head (reference
on left ear) when staring at my blinking movies.  The signals marked by the blue arrows seem to indicate
periods when my brain entrained with the video on every transition of white-to-black and black-to-white.
The periods marked by the red arrows seem to indicate periods when my brain entrained on just the
white-to-white blink rate.

Next Steps:  With this system, I have proven that I can assess the steadiness of my video playback system.  Steady playback is critical to inducing visual entrainment of brainwaves.  So, as I move forward with trying to create a BCI based on visual entrainment, I can use this synchronized photocell recording to confirm that the video stimulation is sufficient to (hopefully) induce EEG responses.  Let the development of the visual BCI begin!

Sunday, May 4, 2014

Inducing Brain Waves with Visual Entrainment

A while back, I had a friend come over and I measured his EEG in response to staring at a blinking light.  We saw (as we hoped) that his brainwaves oscillated in sync with the blinking of the light.  I thought that this visual entrainment (aka "steady-stead visual evoked potential") was pretty cool.  Since then, I've learned that it can be used as the basis for a brain-computer interface (BCI).  Because I'm still searching for a good BCI paradigm, I decided to return to my exploration of visual entrainment.  Today, I'm going to show how I successfully used visual stimuli to induce brainwaves at different frequencies.  As a result, I can now see an good avenue for an EEG-based BCI.  Yes!  Let's go!

Inducing SSVEP Using a Toggling Checkerboard Pattern on my Computer Screen
Goal:  My goal today is to use visual stimuli to induce brainwaves across a range of frequencies.  Because I want to use this for a BCI, I'm trying to determine what kind of visual stimuli I should use and what EEG frequencies I can induce.  What does it take to make this work reliably?

Visual Setup:  In my previous post, my visual stimulation was simply a blinking head-lamp.  It was effective (and really bright!), but I had no control over its blink frequency.  As a result, I also had no control over the frequency of the brainwaves that it induced.  So, for today's test, I needed to get fancier.  I ditched the head-lamp and, instead, created a series of blinking movies that I could playback on my computer.  I controlled the "blinking rate" by saving my movies at different frame rates.  What exactly did the movie look like?  Well, at first, because of a paper that I read in the VEP literature, my movie used the checkerboard pattern shown in the picture above.  The movie toggled back-and-forth between this image and the inverse image (swap blacks and whites).  While this worked OK, I later switched to a simpler movie (code here) where the screen was simply all-white or all-black.  That seemed to work better.

EEG Setup:  Once I made my movies, I set myself up with my EEG system (OpenBCI ).  I my usual gold cup electrodes with Ten20 EEG paste.  I put one electrode on the back of my head (near O1) and I put another electrode on my forehead.  My reference electrode was on my left ear lobe and my bias electrode was on my right ear lobe.  Using the impedance-measuring feature of OpenBCI, the electrode on my forehead had an impedance of 24 kOhm and the one on the back of my head was about 65 kOhm.  I couldn't seem to get the back electrode to a lower value.

Channel 1 was on my Forehead, Channel 2 was on the back of my head.
My left ear lobe was my reference.  My right ear lobe was the bias.

I used my OpenBCI V1 board with Ten20 Paste.
I think that those owl napkins are fun!

Test Method:  Once I got everything setup, I launched the OpenBCI GUI in Processing and started an EEG recording.  To playback my homemade blinking movies, I opened up Windows Media Player and set it to full-screen mode.  I had ten movies, with each movie blinking at a different rate.  I had WMP play all 10 movies continuously in sequence.  Each movie was 20 seconds long, so the whole test took about 200 seconds.  It was nighttime when I did this test and my room was dimly lit.  I tried to stare at the screen and I tried to only blink my eyes at the transition between the different blinking rates.

Results, Checkerboard:  As usual, my preferred way to view the data is to make spectrograms.  In the figure below, the top plot is the data from my forehead and the bottom plot is the data from the back of my head.  From my forehead, there is nothing interesting except my eye blinks.  From the back of my head, we see several interesting features, which I've marked with blue and white arrows.  Note that these interesting features change every 20 seconds, which is the same as my 20-second movies.  It seems clear to me that these features are my brainwaves responding to changing of the blink rate in my movies.  Excellent!


Spectrogram of EEG Signal Recorded While Watching the Blinking Checkerboard Pattern.
The top plot is the signal from my forehead.  The bottom plot is from the back of my head.
"W-B" is the rate at which the movie switched from either white-to-black or black-to-white.
"W-W" is the rate if you measure just from white-to-white.

Entrained with the Blink Rate?  Looking at the three blue arrows, it appears that I have entrained brainwaves at 2 Hz, 4 Hz, and 6 Hz.  At these times, any given square in my movie was blinking at 1 Hz, 2 Hz, and then 3 Hz, if you count from white period to white period ("W-W").  Because I have entrained brainwaves as 2x the white-to-white frequency, it suggests that it is NOT white-to-white that matters, but that it is the transition between white/black or black/white that matters.  At least, that is what is implied for these three (out of 10) cases for the checkerboard stimuli.

Complications:  While that would be a fine conclusion, why does this rule not continue through the other 7 cases in this checkerboard test?  Why does it only work for the three cases with the blue arrows?  The cases with the white arrows do show some sort of EEG response, but not at any frequency that makes sense given the speed of my movies.  What is going on?  I've got two possible explanations: (1) either my movies are not playing back reliably during these other cases, or (2) the checkerboard pattern is too complicated to be a good starting point for learning about my brainwaves.

Modifying the Test:  Of these two possible explanations, it's easier for me to simplify the checkerboard than it is for me to fix the reliability of my movie playback.  So, I changed my movies so that the whole screen is either all all black or all white.  Hopefully, this simpler visual stimuli will make my EEG response easier to understand.

Results, Whole-Screen Blinking:  After recording my EEG while staring at the new movies, the spectrograms of my data are shown below.  Again, all of the interesting action is in the back of my head.  The bottom plot shows that I got good entrainment of my brainwaves for nearly *all* of the new movies.  I'm very pleased.  I'm also very curious about the jump between the cases marked with blue arrows versus the cases marked with red arrows.  What is happening here?

Spectrogram of EEG Signal Recorded While Watching the Whole Screen Toggle White or Black.
The top plot is the signal from my forehead.  The bottom plot is from the back of my head.

What Blink Rate Matters?  Looking at the first half of this plot, the blue arrows indicate cases that have results similar to the checkerboard data shown earlier.  Here, my brain seems to respond to every transition from white to black and from black to white (aka, the "W-B-W" speed).  But, for the second half of this plot, when the blinking is faster, it looks like my brainwaves follow the slower rate resulting from just the white-to-white frequency ("W-W").  Based on this weird result, I'm thinking that my brain doesn't actually care so much about whether the stimuli is W-B-W or W-W...it is simply sensitive to rhythmic visual stimuli in a certain frequency range.  I'm thinking that, whatever rhythmic stimuli falls in this frequency range, my brain will become entrained with it.

Quantifying Entrainment vs Frequency:  If it's simply the frequency that matters, it would be good to see which frequencies yield the strongest entrainment.  Sure, the spectrograms above suggest which frequencies are best, but I took the next step and actually measured the EEG response at each of the stimulation frequencies.  The plot below shows the EEG amplitude that I measured for each of the visual blinking frequencies.  Note that there are two lines, one for if you count based on the white-to-white frequency (blue line) or whether you're counting based on all the white/black and black/white transitions (red line).  This graph suggests that I seem to yield decent responses in the 6-10 Hz frequency range.  So, if I'm looking to use visual entrainment for a BCI, I should focus on the 6-10 Hz band.

Amplitude of EEG Signals Induced by Visual Entrainment.
My best responses seem to be in the 6-10 Hz band.
That could be a good target frequency range for use in a BCI.

Computer Could be Limiting my Performance:  As mentioned earlier, all of these results could be confounded by the possibility that my computer cannot reliably and steadily refresh my screen.  Perhaps it can reliably handle the frequencies at 10 Hz and below, but is not steady above 10 Hz.  Perhaps that's why my apparent response above 10 Hz falls off.  Sure, my computer claims that the screen has a 60 Hz refresh rate, but that doesn't mean that Windows or that Windows Media Player can keep up.  So, any next steps should include some method of assessing whether the computer is actually displaying my movies smoothly at the rate that I expect.

Entrainment for BCI:  My overall goal is to make a cool brain-computer interface (BCI).  Because I am showing that I can successfully measure visual entrainment, I would like to further explore how visual entrainment could be exploited for a BCI.  One idea is that I could simultaneously show two movies side-by-side, each blinking at its own rate.  Perhaps, if I'm lucky, my brainwaves will only respond to the one movie that I'm actually watching.  If that's the case, then I would have conscious control over my brainwaves (and, therefore, the BCI) simply by selecting which of the two movies that I watch.  That could be very cool.


Follow-Up:  I setup a photocell and my Arduino to measure the actual blink rate of the movies on my computer.  In my results, I found that I can't generate steady blinking faster than 10 Hz.  This is probably a strong reason why my EEG recordings exhibited no entrainment above 10 Hz...how can I entrain to signals that aren't there?!?

Follow-Up: I extended this work by having one movie blink at two different rates.  I found that I could control my entrained brainwaves by choosing which of the blink rates I focused on.  Pretty cool!  If you're interested, you can see the results in this post.

Follow-Up:  Interested in getting the EEG data from this post?  Try downloading it from my github!

Tuesday, April 29, 2014

Concentration - Birds Beat the Internet

Now I'm getting serious.  In my last post, I finally saw for myself what "concentration" looks like in my EEG signals.  And now I'm totally hooked.  Now I want to expand my goals.  How?  Well, let's see how my concentration varies during natural activities, not just during my synthetic concentration exercise.  Where to start?  Well, how about at breakfast?  For me, breakfast includes some eating, some Internet, some bird watching...good stuff!  I hoped that my new EEG metric for "concentration" might reveal some interesting trends about my brain while breakfasting.  And, as you'll see, I was not disappointed...

Today's Breakfast Attire...Electrodes on the Forehead and Ear Lobes.

Goal:  My goal was to record some EEG signals to see how my concentration varies with different natural activities.  Today, I recorded EEG while breakfasting.

Setup:  My setup for recording my EEG was similar to the previous post -- a gold electrode on the forehead, a gold electrode on my left ear lobe as reference, and a ear clip electrode on my right ear as bias.  Today, I also added a second gold electrode to my forehead (Chan 1 is my left, Chan 2 is might right).  The picture above shows their locations.  To keep the wires out of my face (important for eating), I looped the electrode wires over my ears.  I connected the electrodes to my OpenBCI V2 board (shown below) and recorded the data using my GUI in Processing.  My electrode impedances measured about 20 kOhm.

My Usual Connection to my OpenBCI Board.  Confusingly, my electrode breakout
is mislabeled..."SRB1" is actually SRB2.

Procedure:  Since I wanted to record natural activities, I did not define a rigid test procedure prior to the test.  Without a scripted procedure, it's really tough to know what you did (and exactly *when* you did it) during a long test such as this.  To address this problem, I setup my camera to record a video of the whole test.  That video is my "truth".  In the movie (some example frames are below), I saw that I spent some time setting up the electrodes, some time eating my food, some time on the Internet (reading and writing), some time gazing out the window at the birds (my favorite part), and some time doing more work on the Internet.  Finally, at the end, I did my regular EEG concentration test -- counting backwards by 3 from 100.  I've got all this as one long EEG record.

I used my camera to record a movie of me eating breakfast.  I used this
as a record of "truth" to see what activity caused what EEG signal.

Data, The Quick Overview:  The EEG spectrogram below is the whole data record as seen my the electrode on the left side of my forehead.  As you can see, there's a block of activity at the beginning (up to 240-300 sec).  This is what was recorded while I was attaching the electrodes to my head.  After that, there's a block of activity from 300-650 sec with some really crazy signals, followed by a long block with more typical EEG signals.  What was happening during that crazy time?

The Complete EEG Record During Breakfast.  Chewing is clearly a very
intense signal that masks all true EEG activity.

Chewing Destroys EEG Signals:  By aligning the EEG data with the movie, it is clear that this period from 300-650 seconds is when I was eating my breakfast.  That morning, breakfast was some wheat Chex and grapefruit juice.  Pretty exciting?  No?  Well, the EEG signals sure are exciting.  See all that strong broadband red activity?  That's the effect that chewing has on EEG.  Dramatic!  I don't know if the cause is muscle artifact or if it is the jiggling of the electrode wires (or both), but the signals are huge!  If you zoom in (not shown), you can see each individual chew.  So, if you wanted a "CCI" (a Chew-Computer Interface) in addition to a "BCI" (Brain-Computer Interface), an EEG system would be a great way to do it.  But, if you wanted to see brainwaves while eating (like I was hoping to see), the act of chewing will basically destroy your data.

The Rest of My Data:  After eating, I still had another 20 minutes (1200 sec) of EEG data, so it wasn't too sad that chewing destroyed the early part of my data.  The spectrogram below zooms in on just the data after my chewing.  This looks like a more normal EEG recording.  Below the spectrogram, I show some processed results.  Specifically, I show the magnitude of the EEG signal in just the 22-100 Hz band, which was chosen based on the "count backwards by 3" experiment in my previous post.  So, if "counting backwards by 3" is considered "concentration", then this blue line is a measure of concentration.  At least, it is a measure of one type of concentration.  In the figure, note that my concentration level does seem to change in response to my different activities.  I find this to be very cool.

Zooming in on the activity after my chewing.  The top plot is the spectrogram of the data.
The bottom plot shows the magnitude of the portion of the EEG in the 22-100 Hz band.

Birds are Better than the Internet:  Looking at the graph above, you can see that my concentration level starts pretty low while I'm working on the Internet.  Surprisingly, the movie shows that I'm not passively reading.  No, it shows that I am actively engaged (mostly typing a reply regarding a theremin).  Given this engagement, I would have expected my concentration to be strong.  Nope.  Compare this to the next section of time, where I'm simply gazing out the window at the birds and trees.  My apparent concentration level (or, at least, my EEG activity in the 22-100 Hz band) gets noticeably higher.  Wow!  Then, when I return to my Internet work, it drops strongly.  I guess that birds are more stimulating than the Internet!  Go birds!

Stronger Concentration Today:  At the end of this test, I closed my eyes and relaxed, which caused my the EEG signal level to drop, as expected.  Then, I opened my eyes and did my concentration exercise where I count backwards by 3.  This portion of my test repeats what I did in my previous post.  In today's recording, however, my signal levels were much higher.  As shown in the plot below, today's data shows 2.8 uV with my eyes closed and 7.6 uV while counting backwards.  Compare this to the previous post where I showed only 2.0 uV and 3.4 uV, respectively.  So, I was 3.4 uV and now I'm 7.6 uV.  This means that my "concentration" intensity is nearly twice as strong!  Why?  Was it because this data was from the morning, when I was fresher and could maybe concentrate "stronger"?  I don't know.  I do find it interesting, though.

Quantifying the EEG Signal Level During the Different Periods.

Summary So Far:  Even with just this simplistic analysis, the data has been way more surprising than I would have guessed.  I would have thought that breakfast would have been a little boring...I mean, I'm just sitting there.  But this data has been surprisingly rich.  Three things have surprised me:
  1. Chewing makes huge signals as seen by an EEG system
  2. Birds and trees stimulate my brain* more than the Internet
  3. My peak concentration level* can change a lot day-to-day
(* In both cases, "my brain" and "concentration level" really just mean "my EEG signals in the 22-100 Hz band".  But it sounds a lot less exciting when said that way.)

One More Thing...:  At this point, I figured that I was done.  I mean, three new findings is certainly enough excitement for me.  But then I remembered that I had data from the 2nd electrode that was on my forehead.  We already looked at the data from the left electrode (spectrogram repeated below).  What did the data from the right electrode show?  Its data as shown as the 2nd spectrogram below, though it's not particularly exciting by itself...it shares many of the signatures seen in the first electrode.  The excitement comes when I examine the "coherence" of the signals between these two electrodes.  The coherence as a function of time and frequency is shown in the third plot.  It looks pretty boring, except right there at the end.  What is happening there?

Measuring the Coherence Between the Left and Right Electrodes on my Forehead.
For the "concentration" signals prior to counting backwards, the signals are
not coherent.  For the counting backwards, they are coherent.  Why?!?
What is Coherence?:  Coherence is a measure of how two signals move together -- if one signal gets stronger, does the other get stronger, too?  If one gets weaker, does the other get weaker at the same time?  Signals that move together have a high coherence (ie, a value near 1.0).  Signals that do not move together have low coherence (near 0.0).  I've analyzed the coherence a couple of times before, such as in this earlier post.

Today's Coherence Data:  For today's data, the coherence plot above shows a few interesting features.  First, in the lower frequencies (10 Hz and below), this plot shows that the signals from the two electrodes on my forehead exhibit high coherence (the plot has a lot of red).  OK.  Above 10 Hz, though, the signals from these two electrodes are not coherent (blue).  Fine.  At then end, though, while I'm counting backwards, these higher frequency EEG signals suddenly become coherent (red). Whoa!  What happened?!?

Counting Backward Must be Different:  If "concentration" is reflected as activity in the 22-100 Hz band, this coherence plot suggests that my "concentration" is different at the end compared to the rest of the test. It appears that the Internet and the gazing outdoors both induce independent (ie, not coherent) activity in the left and right sides of my forehead.  Then, at the end, it appears that my counting exercise causes synchronized (ie, coherent) activity on both sides of my forehead.  Counting backwards must require different brain activity than the concentration associated with the Interent and birds.  While this sounds obvious, these objectively-recorded EEG signals are saying the same thing.  I think that's amazing.

Next Steps:  I've discovered many features in this single recording that get me really excited.  Before I get too excited, I should repeat the experiment.  If these phenomena appear again (especially the finding regarding the coherence), I would feel a lot more confident that it is true.  At that point, I would be really interested in seeing if something similar happens in other people.  If so, perhaps its a known phenomenon discussed in the literature.  Perhaps there is a known cause and a description of the brain mechanism(s) in action.  I'm interested to know!

Follow-Up:  Interested in getting the EEG data from this post?  Try downloading it from my github!

Tuesday, April 22, 2014

Detecting Concentration

A couple of weeks ago, Sparkfun's new product post was all about the Neurosky Mindwave.  What really grabbed my attention was Nick Poole's video of his hack of using the Mindwave to bend a spoon.  That was a really fun and creative way to use EEG to interact with the physical world.  What also grabbed my attention was that it was yet another example of consumer EEG system saying that it detects "concentration", as if it were a well-known and well-defined EEG signature.  Along with terms like "focus" and "relaxation", I always felt that a word like "concentration" was too amorphous for serious consideration.  I mean, what exactly do "concentration" brain waves look like?  What is the signature?  I don't know.  But, given the coolness of Nick's demo, I decided to do some EEG Hacking to find out!


Neurosky Mindwave Electrode Setup:  I don't own a Neurosky Mindwave so I can't use that hardware to explore these "concentration" brain waves.  But, I do have an OpenBCI system, and it's pretty flexible, so I'll try that instead.  The main question is how to setup the electrodes.  Looking at the videos for the Mindwave, and looking at the Sparkfun hack pages, the Mindwave appears to use an electrode on the forehead and then another on an ear clip.  I'm assuming that the one on the ear clip is the reference electrode.  It does not appear to use a bias electrode, probably because they found that it was not needed for this body-mounted, battery-powered system.

OpenBCI Electrode Setup:  To mimic the Mindwave setup, I put a gold cup electrode on my forehead  and another on my left ear lobe.  The one on my forehead was plugged into Channel 1 of my OpenBCI board and the one on my ear lobe was used as the reference.  Because my system is not battery powered, I did use a bias electrode, which was an ear clip electrode placed on my right ear lobe (this is the first time I've tried the ear clip electrodes).  I also chose to stick another gold cup electrode on the back of my head, just to see what happened back there during this experiment.  Oh, and to attach my electrodes, I used standard Ten20 conductive paste.  My impedance check showed about 30 kOhm for each electrode, so not too bad.

Using OpenBCI (V2), 3 gold cup electrodes, and one ear clip.
Oh, and some guy's brain, too.

Procedure:  Watching Nick's video, he says that he is able to trigger the Mindwave's concentration detector by mentally counting backwards by 3, starting from 100.  This sounds pretty straight-forward and he clearly had good success with it.  Frankly, I was a little more skeptical about my own ability to make it happen.  So, in my data, to make it clear to me where I was trying to concentrate, I closed my eyes for a short period before and after my mental counting.  I did this because, by closing my eyes, I would generate strong alpha waves (10 Hz) that would clearly show up in the data.  As a result, after the test, I could look for the data between the two alpha wave recordings...this would be the period when I was concentrating.  Let's see what I got.

My First Look at the Data:  The spectrogram below shows how I typically look at an EEG recording for the first time.  Note that frequency is on the vertical axis and time is on the horizontal axis.  You can definitely see the signature of the alpha waves (that horizontal stripe around 10 Hz) at the beginning and at the end of my recording.  In the middle is the period of time when I was concentrating.  In this plot, I don't see anything interesting during the concentration portion of the test.  I just see some "noise" that looks little different from everything around it.  Bummer.

You can definitely see the alpha waves from my eyes being closed.  Good.
But, is anything happening during concentration?

Higher Frequencies?  But then I remembered reading somewhere (like in one of my own early posts?) that "concentration" was usually seen as increased activity in the higher EEG frequencies -- the so-called Beta waves (13-30 Hz).  So, I replotted the data where, this time, I zoomed way out on the frequency axis.  As you can see below, I'm now showing zero to 100 Hz.  In this new plot, you can clearly see that there is more EEG activity when I was concentrating compared to when I was not.  Now we're getting somewhere!

By zooming out to see the higher frequencies, it does look like there are more activity
in the high frequencies (20-100 Hz) when I am concentrating.  Cool!  (Note: the dark
horizontal stripe in the middle is the effect of my 60 Hz notch filter.)

Comparing the Spectra:  While spectrograms like the one above are helpful for quick qualitative views of both time and frequency, it is difficult to be quantitative with a spectrogram.  So, in the plot below, I show the average spectrum for a period of strong concentration (t = 90-130 sec) and I show the average spectrum for a period where my eyes were closed and my mind was especially quiet (t = 155-178 sec).  As can be seen below, the two spectra are definitely different, especially for frequencies above 22 Hz.

Comparing the average frequency spectrum with my eyes closed (t=90-130 sec)
to the average spectrum while concentrating (t=155-178 sec).  Note that
above 22 Hz, concentration exhibits more signal energy.

Detecting Concentration:  With the knowledge that, in my brain, "concentration" starts to show itself as increased EEG energy above 22 Hz, I can now contemplate building a concentration detector.  The key is to filter my EEG data so that I can assess the intensity of EEG activity in frequencies above 22 Hz.  Then, I'd pick a threshold to which I can compare the EEG intensity level.  If my EEG signals are stronger than my threshold, my detector would say that I am concentrating.  If I'm weaker than the threshold, my detector would say that I am not concentrating.  Sounds pretty easy, right?

Applying to My Recorded Data:  In the figure below, I apply this idea to the data that we've been discussing.  The top plot is the same spectrogram that I showed below.  The bottom plot is what happens when I filter the EEG data to show the intensity just for frequencies between 22 and 100 Hz.  You can see, the trace does indeed move up and down to reflect whether I'm concentrating or not.  Specifically, for the sustained concentration (t = 90-130 sec), my filtered EEG signal is running about 3.4 uVrms.  Then, when I close my eyes and relax (after t = 140 sec), my EEG signals drop down to about 2.0 uVrms.  So, if I were to define a threshold for detecting concentration, I might put it somewhere in the middle...say, around 2,7 uVrms.

Measuring the EEG amplitude in the 22-100 Hz frequency band.  Note how it is low while
my eyes are closed and that it goes higher while concentrating.

Feeling Some Success:  The plot above is making me pretty excited.  It suggests that I have conscious control over my EEG signals.  To date, I've only had strong success with controlling my Alpha waves (by opening and closing my eyes).  I've also had some small success with Mu waves, but they're really hard for me to get.  So, seeing this concentration-induced Beta (13-30 Hz) and Gamma (30-100 Hz) is pretty darned exciting.

Criticism: A critic reading this post might argue that I have not proven any link to concentration.  A critic might say that the increased high frequency EEG energy could just be a natural result of opening my eyes.  Based on the data shown so far, that would be a fair criticism.

Gathering More Eyes-Open Data:  To counter this criticism, the data below is from another test that I performed using the same setup.  In this test, I performed a similar procedure where I started with my eyes closed, had a period with my eyes open, and then finished with my eyes closed.  Unlike the previous test, though, I did not do my concentration exercise during the eyes-open period.  As a result, we should be able to see whether the increased high-frequency EEG activity is due to concentration or due to simply having my eyes open.

A second EEG test where I was NOT purposely concentrating during the eyes-open portion of the test.  Note that the EEG intensity is much less intense than seen during my previous test where I was purposely concentrating.

Not Concentrating:  In the plot above, you can see that there is a trend in my EEG signal strength, but that it is not related to the opening of my eyes.  At the beginning, when my eyes were closed, my high-frequency EEG signals were pretty low at 1.9 uVrms.  Then, when I opened my eyes (t = 210 sec), my EEG intensity increase only slightly to 2.0 uVrms and stayed that way for quite a while.  I think that this is strong evidence that simply opening your eyes does not specifically trigger increased Beta and Gamma activity.

Wandering Mind:  In the second half of my eyes-open period, we do see that my EEG intensity drifts upward.  Eventually, it averages about 2.5 uVrms.  Perhaps this increase reflects that I got bored and started thinking about my next EEG test.  Regardless of the reason, you'll note that even the increase to 2.5 uVrms still does not exceed the 2.7 uVrms threshold that we set a couple of paragraphs ago.  So, this small increase does not meet our criteria for "concentration".

Conclusion:  I think that this second data set is good evidence to declare that intense (>2.7 uVrms) Beta and Gamma activity is not due simply to opening my eyes.  I am feeling pretty confident that the intense high frequency EEG activity seen in the first data set is due to my concentration.  This means that Beta and Gamma activity is under my conscious control, which is the most exciting EEG result that I've had in a long time.

Next Steps:  Being under conscious control means that I could potentially use "concentration" as part of a brain-computer interface for future hacks.  I'm always looking for ways that I can try to control things in the physical world using just my brain waves.  Perhaps with some practice, I could use this technique to compete with Nick Poole in a spoon-bending competition!

Follow-Up:  I recorded my concentration level while eating breakfast, and found some really cool changes!
Follow-Up:  Interested in getting the data from this post?  Try downloading it from my github!

Friday, April 11, 2014

Impedance of Electrodes on my Head

Following from my previous post on figuring out how to get OpenBCI to measure the electrode-to-skin impedance, I figured that now is the time to actually measure the impedance of real electrodes on my actual skin.  I decided to try two types of electrodes: (1) disposable ECG electrodes and (2) re-usable gold cup EEG electrodes.  Here's the story of what I found...

On the left, I'm trying ECG electrodes.  On the right, I'm trying
gold cup EEG electrodes.  In both cases, I'm looking pretty sharp.

Disposable ECG Electrodes:  First, I decided to try some disposable ECG electrodes.  These are cheap and really easy to use.  They're not very good for using in your hair, but they're great for sticking on your forehead.  For the reference and bias connections, I used an ECG electrode on the mastoid bone behind each of my ears.  The picture below shows the pre-gelled, self-adhesive ECG electrodes that I used along with the clip-type ECG electrode wires (see this post for specific recommendations).

ECG Electrodes and Clip Leads That I Used on my Head

Once I stuck three of these electrodes on my head (forehead and behind each ear), I connected the lead wires to my OpenBCI V1 board using my homemade adapter.

Connecting the ECG Leads to my OpenBCI V1 Board.

After getting all connected, I activated the ADS1299's "Lead Off" excitation signal for the channel that was connected to the ECG electrode on my forehead.  As discussed in my previous post, the excitation signal is a 6 nA AC current source that the ADS1299 toggles at 31.2 Hz.  The flow of current through the electrode creates a voltage that can be measured by OpenBCI just like a normal EEG signal.  I configured my OpenBCI board to digitize the data and send it to the PC.  On the PC, I used the OpenBCI GUI to view the data in real time and to record it for post-test analysis.

A zoomed-in plot of the recorded waveform is shown on the left of the figure below.  As you can see, it has a fairly large amplitude of 508 uVrms.  This corresponds to an impedance of 120 kOhm.  That's really big!  Being surprised by that large value, I swapped the wires around so that I was measuring the electrode that I had been using as my reference (or "-") electrode.  As seen in the waveform above on the right, I got a very similar value.  That's not cool.

Example Waveforms Recorded While Using OpenBCI To Measure the
Electrode-to-Skin Impedance of (Left) the ECG Electrode on my
Forehead and (Right) the ECG Electrode behind my Left Ear.

Zooming out so that you can see more of my recording, the figure below shows about a minute's worth of data.  This is the full recording from which I made the excerpts shown above.  The longer view below shows the story of me recording data for one electrode (up to about t = 119), of how the signal goes away as I unplug and swap the electrode connections (from t = 120 to t = 132), and then how the signal returns once I am connected to the other electrode.  Again, you can see that I measured 120K from one electrode and 116K from the other electrode.

Zoomed-Out View of my Recordings Using the "Lead-Off Detection" Excitation
while Using Disposable ECG electrodes.

Gold Cup EEG Electrodes:  Because I found the impedance of the ECG electrodes to be surprisingly high, I tried using some gold cup EEG electrodes.  The picture below shows the electrodes and the conductive electrode paste that I used.  Like with the ECG electrodes, I put one of these on my forehead, one on the bone behind my left ear for the EEG reference and one one the bone behind my right ear as the EEG bias.

Gold Cup EEG Electrodes and Ten20 Brand EEG Paste

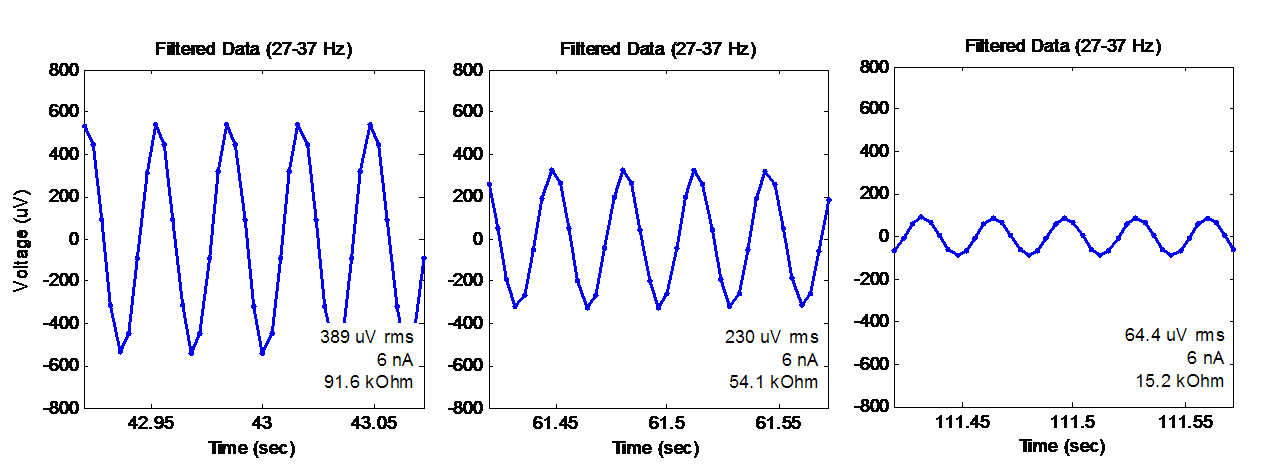
After putting on the electrodes, I activated the "Lead Off" excitation, like before.  Some examples waveforms from the data that I recorded are shown below.  As expected, the waveform shape is the same as seen before, but the amplitude is different, which reflects the fact that the impedance of the electrode-to-skin interface is different.

Waveforms Recorded from the Gold Cup Electrodes During the "Lead Off" Excitation.

Notice that the three plots show decreasing amplitude, which means that I was getting better contact and less impedance in each case.  What was happening?

Well, for the first waveform (the one on the left) was shows what I measured when I first attached the electrodes.  It shows an RMS amplitude of 389 uV, which corresponds to an impedance of approximately 92 kOhm.  This was still higher than I wanted, so I fiddled with the electrode and pushed it into my skin to try to make better contact.  That's when I got the middle graph -- 230 uV and 54 kOhm.  Finally, I pulled off the electrode, replaced the conductive paste, and really pressed and twisted the electrode against my skin.  That's when I got the graph on the right -- 64 uV, which corresponds to 15 kOhm.  That is more like the kind of value that I was hoping to see.

Below is a zoomed-out plot of the whole scenario with the gold cup electrode.  Again, this is the full record from which I made the excerpts above.  On the left side of the plot, you can see the 389 uV, 92 kOhm condition that I showed before.  Then, you can see my multiple attempts at re-seating and re-pasting the electrode.  Finally, at the end, I finally got to the 64 uV /  15 kOhm condition.  So, while it does take some effort, it is possible to improve the electrical contact between the electrode and your skin.

Zoomed-Out View of my Recordings Using the "Lead-Off Detection" Excitation
while Using the Gold Cup EEG Electrodes

Why Were the ECG Electrodes So Bad?  This experiment started with the ECG electrodes, which yielded a very high impedance of 120 kOhm.  If I could only use the ECG electrodes, this high impedance value would have prompted me to remove the electrode, to scrub the skin (hard!) with alcohol and a rough pad, and then to attach a new electrode.  Maybe this would have worked to lower the impedance, or maybe not.  If it would not have helped, the problem could be that my ECG electrodes are really old.  If you look really closely at my picture showing the electrodes, you'll see that the ECG packet in the background shows a date of "June 2012".  Yikes!  I have a friend who is developing a hacker-friendly EMG system (go FlexVolt!) who has mentioned to me that he has seen difficulty when using old ECG electrodes.  So, I'm thinking that maybe disposable electrodes have a limited shelf life...and that 2 years is maybe too old.

Next Steps:  With the impedance monitoring working on my OpenBCI board, I'm hoping that it will enable me to make more reliable EEG recordings. Hopefully, getting good low-impedance connections will increase my chances of detecting those low-level signals that have vexed me with their sometimes-I-see-them and sometimes-I-don't behavior.  In particular, I'm thinking about those pesky Mu waves that have been hard for me!  We'll see if this impedance checking can help...

Thanks for reading!

Follow-Up: Want to get the data from this post?  Try downloading it from my github!

Thursday, April 10, 2014

OpenBCI: Measuring Electrode Impedance

An important driver of EEG signal quality is how well the electrodes are electrically connected to the skin.  Common clinical and research guidance often says to use skin cleansing and skin abrasion to get the electrode-to-skin impedance down below 10 kOhm or even 5 kOhm.  If you don't, you can get noisy or unrepeatable measurements.  Most EEG systems allow you to measure the impedance at each electrode.  The OpenBCI system that I have been helping to develop is also capable of doing this (see other's work on using the ADS1299 to measure impedance) but I have not taken the time to figure out how to use it.  Until now...

Measuring Electrode Impedance Using the ADS1299's "Lead Off" 6nA Current Source

Impedance from Voltage and Current:
  The main idea with measuring the impedance of the electrode-to-skin interface is for the EEG system to inject a known current through the electrode and to measure the resulting voltage difference.  Since V = I*R, you can easily compute impedance "R" by taking the measured voltage "V" and dividing by the known current "I".  Pretty easy, right?  Well, how do you inject the current?  And how do you measure the voltage across the electrode-to-skin interface?

Injecting the Known Current:  The core of the OpenBCI board is the ADS1299 integrated circuit from Texas Instruments.  It has a feature called "Lead Off Detection" that does this trick of injecting a known current into each electrode.  As you can see in the figure above, a very small current (shown as 6 nA) is forced into the electrode line by a current source built into the ADS1299.  So, no matter how much resistance or impedance is between the current source and ground (within reason, of course), the system forces 6 nA through the electrode to ground.

What is Ground?  Unless you are sitting in salt water or touching something big and metal, it is unlikely that your body is connected to ground.  To address this, an EEG system often provides an extra connection in addition to the regular electrodes.  This extra connection is usually called something like "bias", or "driven ground", or "driven right leg (DRL)".  The purpose of this connection is to keep your body's DC voltage level within an acceptable range and to keep any common-mode AC signals in your body minimized.  Therefore, the bias line will act to source or sink whatever current as necessary (within reason) to minimize your DC and common-mode AC signals.  As a result, for the 6nA current that we are injecting, "ground" is the bias driver, as shown in the figure above.

Making a Mental Model of Where the Current Goes

Measuring Just the Electrode-to-Skin Voltage:   If the bias driver is our ground, the figure shows one way to model where the current goes.  Note that the current passes through several unknown impedances on its way to ground.   How do we evaluate just the impedance of the "+" electrode's interface to the skin?  The answer is to remember that an EEG system measures the voltage between its "+" input and its reference (or "-") input.  Because of the high-input impedance of the differential amplifier, no current flows into the "-" electrode line, so none of its impedance elements matter (for the purpose of this measurement).  Therefore, we can easily measure just the voltage drop across the first three elements -- the 5K in-series resistor, the electrode-to-skin impedance, and the impedance of a portion of the human body.  Because the series resistor is known, and because the impedance of the body is too small to matter, we have only one unknown remaining -- the impedance of the electrode-to-skin interface.

Calculating the Impedance:  The model above shows the electrode-to-skin interface as a simple resistor.  While this is not quite right (it does have a capacitive component as well), we can use this model to roughly estimate the number we need.  Following from the basic V = I*R, we shuffle the terms to get R = V/I.  We know both "V" (the measured voltage drop) and "I" (the known 6 nA current), so we easily get "R".  The only trick is to make sure that you're using compatible units for voltage and current.  In my case, I'm measuring the voltage as an *RMS* value (not an amplitude value).  My current value (6 nA), however, is an amplitude value, not an rms value.  So, to make the units compatible my calculation must includes a factor of sqrt(2) to convert RMS into amplitude:

R = (Measured Voltage * sqrt(2))/(Known Current) 

Finally, remember that the "R" here is the the series resistance of the electrode-to-skin interface plus the 5K resistor built into the OpenBCI board.  So, to get the impedance of just the electrode-to-skin interface, you need to subtract 5K.

Testing on OpenBCI:  To confirm that this all works in real life and not just on paper (or, um, just on a blog page), I used one of my OpenBCI boards to test it out and confirm that it works.  The simplest test that I could devise was to use clip leads (see picture below) to jump together the electrode connectors.  Specifically, I connected four of the "+" electrode connectors to the single reference (ie,"-") electrode connector, which is then jumped to the bias electrode connector.  This configuration eliminates all of the electrode-to-skin impedances and the human body impedances.  The only impedances remaining are the 5K series resistors.  Hopefully, when I do my voltage measurements and divide by the 6 nA current, I'll get a number close to 5K.


Testing the Impedance Measurements on an OpenBCI V1 Board.
The colored wires are directly connecting  (ie, shorting) the electrodes
to the reference electrode and to the bias electrode.

Configuring for the Test:  Because I only had a few clip leads, I could only jumper four of the eight "+" electrode connectors.  As a result, when I ran OpenBCI, I only activated channels 1-4.  I configured the "Lead-Off Detection" settings to generate a 6 nA current source at a frequency of 31.2 Hz.  I then started to activate the current sources on the "P" side of each EEG channel.  I saw that I could activate and deactivate the signal on any given channel without affecting the signals seen on the other channels.  Excellent.

Screenshot of the OpenBCI GUI when running an impedance test on channels 1-4.  Click to zoom.
Note that ~31 Hz test signal is present in the first four channels
and that the resulting per-channel impedance is 5.4-5.8 kOhm.

Results:  With all four current sources active, I got the results seen in the screenshot above.  As you can see (click to enlarge), a 31 Hz signal is present in the first four channels.  You can see this in the time-domain montage on the right and in the frequency spectrum plot in the bottom-left.  On the time-domain plot, you can see that my labels indicate that the voltage induced on each EEG channel is between 23.0 uVrms and 24.5 uVrms.  Using my equation from a few paragraphs back, this yields impedance estimates of 5.43 to 5.77 kOhm.  Since I'm expecting to see the resistance of each channel's 5 kOhm resistor, this corresponds to an error of 9-15%.  Given that the ADS1299 datasheet says that the "known" current is only known to +/- 20%, I find my result to be very satisfying.  I'm feeling pretty happy right now.

Super-Advanced Topics:  With the method described above, you can measure electrode-to-skin impedance of the electrodes attached to the "P" inputs of this system.  The question remains on how to measure the impedance of the reference electrode (which is attached to the "N" inputs) and of the bias electrode.  The short answer for the reference electrode is that you can use the similar ADS1299 feature for the "N" channel (as long as you do not use SRB1 as a cheater way to mux the REF to all of the "N" inputs, which is what we do in OpenBCI V1).  And the short answer for the bias electrode is that the ADS1299 can detect if it is attached, but it cannot measure its impedance.  Luckily, the impedance of the bias electrode is not as relevant.

Overall Success:  So, I'm feeling pretty good about getting this impedance measuring to work.  The code for implementing this has been pushed to the OpenBCI GitHub.  The next step is do do some impedance measurements using actual electrodes on my actual head.  Look for a follow-up post!

Follow-Up:  I measured the impedance using disposable ECG electrodes as well as re-usable gold cup EEG electrodes.  You can see the results here:

Follow-Up: I linked this post to answer a question on the Texas Instruments user forums (regarding the Texas Instruments ADS1299 chip at the heart of OpenBCI).  This post was recognized by TI for a TI Community Award, Aug 2015.  Thanks, TI!