Showing posts with label Setup. Show all posts

Sunday, January 19, 2014

Blinky Lights - Visual Entrainment

In talking up my EEG hacking with some friends, I found a buddy who was really interested.  In particular, he was interested these smartphone apps that claim to affect your sleep state.  My friend wanted to know if these apps actually did anything to the brain.  That's a pretty cool question, and very similar to the question that I had about meditators (see their results here and here).  To figure out if his sleep-modifying apps were doing anything to his brain wave, he volunteered to be my guinea pig.  What a guy!

A Willing Guinea Pig Meets the Red EEG Cap


This post shows some of the data that I collected...though not yet when subject to the sleep app.  I decided to start simple and record how his particular brain responds to sensory entrainment.  Entrainment is how these sleep apps work, so if we understand how he responds to entrainment in general, we'll be well-positioned to understand his response to the sleep apps.  So

Background:  It is my understanding that the sleep apps work by playing specially-constructed sounds into your ears via headphones.  They're trying to induce certain brain rhythms (Delta, Theta, Alpha, Beta, etc) by playing audio into your ears at the same frequency as the desired brain rhythm.  Put most simply, they play a 10 Hz tone into your ears and hope to get brain waves at 10 Hz (ie, Alpha rhythm).  This is called entrainment and is a long-known phenomenon in EEG.  Personally, I'm not too familiar with this type of auditory entrainment, but I do know that visual entrainment, so I'm going to start there.

Setup:  I'm using the same setup as I used for my recordings of meditators.  I used an EEG electrode cap (this is the first time using the red-colored cap, though...exciting!) with the EEG electrode gel that came with the electrode cap kit (ECI Electro-Gel).  We used the same electrode montage (see figures below), the same reference electrode (near FPz/AFz) and the same ground/bias electrode (right mastoid).  For electronics, I used an OpenBCI V1 board with an Arduino streaming data to my PC running our full GUI that was written in Processing.

Baseline, Eyes-Closed Alpha:  Since I had never recorded my friend's EEG before, I decided to start with the most basic recording -- I had him close his eyes so that we could see his Alpha-wave posterior dominant rhythm (PDR).  The spectrograms in the montage below show his response...it is very normal.  Note the energy in the Alpha band (~10 Hz) that shows up most strongly in the back of his head and not at all in the front of his head.  As I said, very normal.

Spectrograms of EEG Signals Recorded With the Eyes Closed.
Notice the Strong (and typical) Energy in the Alpha Frequencies.
Click to Zoom.

In the figure below, I summarize this PDR Alpha response across the eight electrodes.  It shows that his Alpha peaks at about 10.25 Hz.  His Alpha are a bit stronger on the left side of his head (channel 7, green) than on the right (channel 8, blue).  That's also what happens with me.  I've always wondered if this asymmetric Alpha response is related to handedness.  I'm right handed.  I don't know handedness my friend is.  It would be interesting to record a lefty and see what happens!

Average EEG Amplitude Recorded With Eyes Closed and Relaxing.
Notice the Strong Peak in the Alpha Band (~10 Hz).
Finally, the last thing that I'd like to examine with his eyes-closed Alpha data is the spectral coherence of the EEG signals from neighboring electrodes.  This is a quantity that I first analyzed in this post on my second meditator.  It shows how strongly related (how correlated) are the signals between two electrodes.  I use this type of analysis to estimate whether the different physical areas of the brain are working together or independently.

Below are the cross-channel coherence plots for my friend sitting with his eyes closed.  Like with my meditating friend, he shows very little coherence in the front of they head (those areas must be acting independently relative to each other) and more coherence towards the back of the head.  Looking specifically at the Alpha band, it looks like the Alpha seen between electrodes 5 and 7 (ie, back left) are strongly related to each other.  Same with the Alpha seen between electrodes 6 and 8 (ie, back right).  In the very back of the head (7 and 8), the 10 Hz energy is not very coherent between the two hemispheres, even though they are physically closer together that 5/7 or 6/8.  This is so interesting to me.  It is also the same result that we saw with my meditator friend when he was not meditating.

Spectral Coherence Between Neighboring Electrodes.   Strong coherence (red) implies coordinated
EEG activity whereas low coherence (blue) implies independent EEG activity.
Click to Zoom.

Visual Entrainment:  Now we start to do something new.  To see how entrainment works, I started with the easiest sensory entrainment that I know about -- visual entrainment.  The idea here is that you blink a light at a certain speed and you look for brain rhythms at that same frequency.  Truth-be-told, I wasn't actually planning on doing this test, so I didn't have a good light prepared.  But I do have a nice new, really-bright hiking headlamp that has a blink setting.  I don't know exactly what speed it is, but I counted blinks and it's less than 5 Hz.  Sadly, it's blinking rate isn't as steady as I might like.  But, when you're EEG hacking, sometimes you gotta be quick and dirty.

[WARNING!  Be careful doing this kind of test at home!  Blinking lights like this can induce seizures!  Proceed at your own risk!]

To do my visual entrainment test, I darkened the room and had my friend sit in a chair, like before.  I held the blinking light about a foot and a half from his face (see picture below).  We did part of a recording where his eyes were open and looking at the blinking light (so bright!), then he closed his eyes while the blinking continued, then he opened his eyes again.  It turns out that only the eyes-closed portion gave decent results, so that data is what I'm going to focus on.

Attempting Visual Entrainment Using a Blinking LED Hiking Headlamp

If we start with the spectrograms (below, you might want to click on the figure to see it bigger), you'll see that we got a nice line of energy down at the low frequencies (~4 Hz).  The line only appears when both the light was blinking and when his eyes were closed.  Note that it shows up in all EEG channels, but it appears to be a bit stronger on the right side of his head.  These lines in the spectrograms mean that his brain waves were indeed being induced to oscillate at the same rate as the blinking light.  It's a well known effect, but I still think that's kinda cool.

Spectrograms of EEG Signals Recording With Eyes Closed with a Bright Blinking Light.
Click to Zoom.

These spectrograms are summarized in the single spectrum plot below.  It shows a peak at 3.9 Hz, which is most likely the blinking rate of my head lamp.  The amplitude of the entrained waves is quite strong --  note that it is similar in amplitude as the eyes-closed baseline Alpha waves that we recorded earlier.  This graph also confirms that the entrained waves are a bit stronger on the right side (channel 8, blue) versus the left (channel 7, green).  If you remember from above, his baseline eyes-closed alpha waves were the opposite -- they were stronger on the left.  Finally, perhaps most surprising of all is that there are no Alpha waves at all.  Remember, his eyes are closed just like before.  Yet, there are no Alpha waves.  The presence of the blinking light apparently suppresses his natural rhythms (the Alpha) and entrains a rhythm at its own blink rate (the 3.9 Hz signal).

Average EEG Amplitude Recorded With Eyes Closed and A Bright Light Blinking
Notice the Strong Peak at 3.9 Hz (the Blink Rate) and the Absence of Alpha Waves.

Finally, let's look at the spectral coherence across neighboring EEG channels.  The plot below shows strong coherence at these low frequencies (3.9 Hz) across all pairs of channels except for the 1/3 pair (front left) and the 2./4 pair (front right).  Why are these not coherent yet the others are?  I don't know.  The 1/3 pair and the 2/4 pair do have the largest physical spacing of any of the pairs, but I still find it surprising.  I mean, even the cross-hemisphere pairs of electrodes (the 1/2 pair in front and the 7/8 pair in back) show good coherence, but not these 1/3 and 2/4 pairs.  I'm not sure what it means (the front's response is independent of the whole rest of the brain?) but I'll be sure to keep an eye on the 1/3 and 2/4 coherence in the future to see if there is a trend.

Spectral Coherence Between Neighboring Electrodes During the Eyes-Closed Blinking Light Test.
Click to Zoom.

Conclusion:  OK, what have we learned?  We learned that my buddy looks pretty cool in that red EEG cap.  And we learned that his brain is a mysterious place that emanates lots of cool signals.  His willingness to be my guinea pig gave me lots of data from which I have made lots of nerdy graphs.    Here's what I learned from the graphs:

  • His eyes-closed alpha waves are similar to the others that I've measured
    • Similar frequency (~10 Hz)
    • Similar amplitude (~4 uV RMS)
    • Similar spatial distribution across the head (strongest in the back)
    • Similar coherence pattern (back-left and back-right, but not cross-hemisphere)
  • We successfully induced visual entrainment with the blinking light (3.9 Hz)
    • Similar amplitude as the eyes-closed Alpha waves (~4 uV RMS)
    • Entrained brain waves appear all over the head
    • Entrained brain waves are coherent everywhere except front-left and front-right
    • The blinking light suppressed the PDR Alpha response

But what does it all mean?  Does it mean that the sleep-modification app on his smartphone will do anything?  No, this data and analysis does not speak to that question at all.  The goal here was just to help me (us?) learn about sensory EEG entrainment in general, and about my friend's individual EEG response in particular.  Now, that we've done the easy thing and gotten a bit smarter, we can maybe move on toward the harder thing (auditory entrainment) to try to answer the question as to whether the sleep-modification brainwave app is doing anything.  Now I have a better idea of what to look for.

So, thanks for reading.  This is so fun!  (for me at least...)

Next Steps:  In this follow-on post, I use a computer screen instead of a blinky light.  I show that I can entrain brain waves at a variety of speeds.  This is the first step in making an entrainment-based BCI!

Follow-Up:  I used visual entrainment to control a six-legged walker...with my brain waves!

Saturday, January 18, 2014

EEG Electrode Adapter - Version 2

As many people are aware, many commercially-available EEG electrodes use an unusual connector called a "touch-proof" connector.  If your EEG system does not use these connectors, you need to either replace the connectors on the electrodes, or you need to make an adapter.  While it is a sensible choice to cut up your electrodes, I prefer to make an adapter.  My previous version of such an adapter worked really well, but it was a bit fragile.  So, I decided to try again.  I also decided to work with a friend of mine who's a little smarter about these kinds of things.  Here's what we came up with.

My Revised EEG Electrode Adapter ("V2") attached to an OpenBCI Board

Problems with the Previous Version:  The picture below shows my previous version of the adapter.  The good part was that the adapter was really small.  I liked that.  The bad part of this adapter (in addition to the fact that I never finished all of the connections) was that it was quite fragile. Specifically, the soldering of the wire to the female connector had no strain relief, which meant that mating the connector always threatened to break the wiring.  Another problem was that I was always confusing which electrode I had plugged into which input on the OpenBCI board.  I really needed to remake the adapter so that it was easier to see which were the "special" connections (SRB, Bias, and 8P) versus all of the "normal" connections (1N-8N).  These are the deficiencies that I focused on in this revision.

My First Attempt at an EEG Electrode Adapter ("V1")
Revised Approach:  With this iteration, my friend and I decided that it would be best if the female touch-proof connectors were mounted to some sort of rigid frame instead of merely being attached to the ends of the wires.  This would give the strain relief that we needed when mating and de-mating the connectors.  To address my other issue -- getting the connections confused -- I decided to use color-coded connectors, instead of just the black connectors in my first build.  Easy.  Ok, let's go!

Parts:  The parts are all the same as in the first build.  The female touch proof connectors are P/N 36145 from Plastics One.  The ribbon cable is just a set of female-female jumper wires from Adafruit (P/N 266).  This time, we also used a piece of scrap plastic channel that we had lying around, probably originally from McMaster-Carr.  And, as you'll see, I used a thin scrap piece of plastic sheet and a wide piece of shink tube, both from our generally pile of "goodies for a future project".  None of these pieces (except for the female touch-proof connectors) are particularly critical, so use what you have.

Assembly:  My buddy who came up with the idea of using the plastic U-channel as a mounting plate did all of the of the assembly.  He started with drilling a bunch of holes in the U-channel into which he pressed in the female connectors.

Touch-Proof Connectors Mated to the U-Channel -- For Strength!

He then took the purchased wires, pulled off (as a group) the number of wires that we needed and cut the existing connectors off one end.

Inexpensive Jumper Wires Used for My Wire Bundle

To keep the individual wires from splitting themselves off the ribbon, he reinforced the ribbon with a flat piece of plastic and a big piece of shrink tube.  Here's him preparing the items.  The red thing is the big shrink tube and the yellow-ish thing is the scrap bit of flat plastic that he'll use for the reinforcement.


Preparing the Shrink Tube (Red) and Scrap Plastic (Yellow)
to Reinforce the Wire Bundle

With the wire bundle prepared, he soldered the individual wires to the back of the touch proof connectors.  He used some normal size shrink tube to protect the individual solder joints on the back of the connectors.  Very nice.

Connecting the Individual Wires to the Back of the
Touch-Proof Connectors.

And that's all there is to it.  A picture of the completed unit is below.  You can also see it attached to an OpenBCI board at the top.  In the picture below, you can see how reinforcing the ribbon cable was an important feature for keeping the wire bundle from falling apart.

The Finished Adapter.

Pin-Out:  For anyone wondering why I used the unusual color scheme for the connectors, the idea is to clearly indicate that some of the electrodes have different functions.  So, if you use this adapter to connect to the OpenBCI V2 board as shown in the zoom'd picture below, or like the one at the top of this post, the order of the connections is this, from left to right:

   Red: Bias  (aka. driven ground)
   Blue: 8N  (the regular input for channel 8)
   Red: 8P  (the reference input for channel 8, if selected in software)
   Blue: 
       7N  (the regular input for channel 7)
       ...
       1N  (the regular input for channel 1)
   Red: SRB2  (the reference input for all channels)

Further Revisions:  After working with this revised piece for a bit, I found that there is still room for improvement.  For example, in connecting the adapter to the OpenBCI board, it is important to connect the wires in the right order.  The right order is shown below.  At first, I thought it was a good idea that I kept the individual female pin connectors on each wire of the adapter.  I thought that I'd like the freedom and fllexibility that this might provide.  I was wrong.  I should have swapped out the individual female pin connectors for a ganged female connector that would have kept them all in the right order all of the time.  I was wrong.  (So, to the EEG hacker that I'm handing this adapter off to, sorry for the annoyance!).

The Correct Order for the Individual Wires.

So that's the story of the hacking of this electrode adapter.  The real solution, of course, would be to have the connectors on the electrodes and on the EEG system (OpenBCI, in my case) be the same.   The easiest thing would be to put female touch proof connectors on the OpenBCI board.  But, the PCB-mount version are almost $2/each, even in quantity!  This is completely incompatible with the price of the OpenBCI board.  So, the next option would be to buy electrodes with a connector system that we could afford.  That would be a really nice solution to this problem of making kludge-y adapters.

Monday, December 30, 2013

Breathing Meditation - Alpha Amplitude

It turns out that my previous post on EEG and meditation was surprisingly popular.  The post even got one of my friends interested enough that he, too, wanted to see what happened to his EEG signals while he was meditating.  So, we hooked him up to one of my OpenBCI boards and took some measurements!  Here's the story of what we found together.

My second willing meditator.
(And the blue cap returns!)

Goal:  My goal with these recordings is simply to see if meditation has a measurable effect (any effect) on one's EEG signals.  I'm trying understand if a particular form of mental activity (ie, meditation) can be measured objectively.

Setup:  For this set of recordings, we decided to go the Full Monty and bring out the blue EEG cap (see photo above).  This was the same cap as used with the previous meditator.  We got the cap as part of a kit that we bought from Biopac.  Our cap has lots of electrodes.  We chose to use the eight electrode locations shown below.  Our reference electrode was towards the front of the head along the centerline (near FPz/AFz) and our driven ground (aka "bias") was attached behind the right ear (right mastoid).  We used the electrode gel that came with the kit from Biopac.  For data logging software, we used the OpenBCI GUI that was written in Processing.

Electrode locations used for these recordings.
Fp1, Fp2, C3, C4, P7, P8, O1, O2.
Reference electrode was near Fpz.
Driven ground ("bias") was the right mastoid.

Two Test Scenarios:  My meditating friend performed two sets of recordings: one while meditating and one while simply relaxing.  The non-meditating data will act as a baseline against which we compare the meditating data.  Note that the two recordings were done in back-to-back sessions without removing the electrode cap.

Test Procedure:  Both session started with an initial period with his eyes opened followed a long period with his eyes closed.  It is during this eyes-closed period where he was either meditating, or he was simply relaxing but not meditating.  When he is meditating, my friend's meditation style is breathing meditation, where he focuses solely on his breathing and on his body's response to his breathing.

Example Results:  Example data from his baseline recording session is shown in the spectrogram below.  This data is from an electrode on the back of his head (channel 7, which is at O1).  In this figure, you can see that once he closes his eyes, he exhibits a strong EEG signal around 10-12 Hz, which is in the Alpha band.  This eyes-closed Alpha rhythm is a very typical EEG pattern.  In this recording, there is also a faint signal between 20-25 Hz, which is simply a harmonic of the fundamental 10-12 Hz Alpha wave.  Overall, this Alpha-dominated signal seems to be very consistent with most other eyes-closed data that we've recorded from other individuals (including myself).

Example EEG data recorded during the baseline (ie, not meditating) session.  This is from the back of his head.  The horizontal stripe of signal energy is around 10-12 Hz, which is in the Alpha band.  Alpha waves are indeed commonly seen when one's eyes are closed.

Full Baseline Results:  The plot above shows data from just from one location on the head.  The figure below, by contrast, shows all eight channels of EEG data that we recorded.  It gives a fuller picture of what is happening during the baseline (non-meditating) recording session.  Like in the single example above, the plot below shows that many of the electrodes pick up the steady Alpha rhythm when he closes his eyes.  You can see, though, that the Alpha rhythm is much stronger in the back of the head than in the front.  Since this eyes-closed "posterior dominant rhythm" originates in the now-idled visual cortex (which is the back of the brain), the fact that the Alpha waves are strongest in the back of the head and weakest in the front is exactly what we would expect to see.

EEG data recorded while relaxing but not meditating.  Notice that the Alpha waves (the horizontal stripe of energy in each plot) are strongest towards the back of the head.  Click on the figure to enlarge.

EEG Data While Meditating:  Now we get to the good stuff.  Now we turn our attention to the data recorded while my friend was meditating.  The figure below shows the data recorded while he was meditating.  The meditating began when he closed his eyes, so I've limited my examination just to the eyes-closed data.  Clearly, the dominant feature is that horizontal stripe of energy in the 10-12 Hz band representing the eyes-closed Alpha rhythm.  This is the same kind of signal that we saw when he was not meditating.  So, to first glance, meditating does not have an obvious effect on his brain waves.  For example, it did not make the Alpha waves disappear nor did it make any new signals appear.  If there are any changes due to meditating, the changes must be subtle.

EEG Data recorded while meditating by focusing on his breathing.  Alpha waves still dominate.  Click on the figure to enlarge.

Change in Alpha Amplitude:  Comparing these two figures more closely, one change that I do see is that the intensity of the Alpha waves appears to decrease when he is meditating.  Because this change in amplitude is difficult to see quantitatively in the spectrograms, I replotted the data as basic spectrum plots, as shown below.  In these new plots, I've included just the eyes-closed data.  These new plots clearly show that the dominant EEG energy is between 10-13 Hz, which are the Alpha waves.  We see that the Alpha waves in both the baseline and meditating recordings are centered around 11.72 Hz, so meditating did not change the speed of his Alpha waves.  We do see, however, that the amplitude of these Alpha waves are smaller when meditating.  In fact, we see that the amplitude is cut nearly in half (6.1 uVrms down to 3.6 uVrms).  That's a pretty big change!  While we cannot yet be sure that change was caused by the meditation (repeated tests would be necessary to confirm a cause and effect relationship), this data is highly intriguing and begs for additional recordings.  This is cool.

Amplitude of the EEG signals recorded  when his eyes were closed during the baseline test (left figure) and during the meditation test (right figure).  As can be seen, the strongest signals are between 10-13 Hz, which are Alpha waves.  His Alpha are centered on 11.72 Hz.  You can see that the amplitude of his Alpha decreases while he is meditating.

Comparison of Alpha to the Meditator at Maker Faire:  Looking at my previous post for the meditator at Maker Faire, we saw that the previous mediator had very different brain patterns than seen above.  First, the meditator at Maker Faire showed no Alpha waves at all.  None.  While most people do exhibit Alpha when the eyes are closed, eyes-closed Alpha is not universal.  So, it is possible that the meditator at Maker Faire is simply one of those individuals who does not exhibit eyes-closed Alpha.  Or, as an alternate conjecture, perhaps the act of meditation suppresses Alpha waves.  Perhaps our highly-experienced meditator at Maker Faire completely suppressed his Alpha response, whereas the novice meditator shown above only showed moderate suppression of his Alpha response.  Again, we have insufficient data to make any real conclusions, but this is very intriguing.

Comparison of Beta Waves to Meditator at Maker Faire:  Another key finding from the meditator at Maker Faire was that his meditation seemed to generate EEG activity in the 15-20 Hz band, which are the low-end Beta frequency range.  His generation of Beta waves is in contrast to the novice meditator shown here, who showed no change in Beta activity.  Perhaps the lack of Beta activity is due to his inexperience, or perhaps it is due to a difference in the type of meditation.  As discussed in the Travis paper linked previosuly, different types of meditation are known to correlate with different EEG responses just as different types of mental activity can generate activity in different EEG frequency bands.  So, perhaps the Maker Faire meditator was performing a "focused attention" style of meditation (which is associated with increased Beta) whereas today's meditator was more of an "open awareness" style  of meditation (which is not associated with Beta).  I am not properly educated in the different styles of meditation, so I really should not comment on this further.  Perhaps it would be best to get the individual meditators themselves to describe their own meditation style relative to the criteria defined in the Travis paper.  That would probably be the best approach.

Conclusions:  With only a single pair of recordings from a single individual from a single sitting, we cannot draw any solid conclusions.  What we can say is that we happened to see a decrease in the amplitude of the alpha waves in the back of the head during meditation.  If this change is actually due to the meditation, it shows that the meditation is indeed having measurable changes on brain activity.  I have no idea whether changing the amplitude of the Alpha rhythm is a good or bad thing...I just think that it is interesting that we can measure any change at all.  I would love to be able to confirm this finding or to see it in other people.

Next Steps:  This has been a very basic analysis of the EEG data that we recorded.  For example, in quantifying the amplitude of the Alpha waves, I simply looked at each EEG channel in isolation from the others.  Sure, I noted that the Alpha were strongest in the back, but I did not look at any more subtle changes with how the different channels correlate with each other.  It is possible that the act of meditation brings different regions of the brain into concert with each other.  Or, maybe meditation does the opposite and causes different regions of the brain to become decoupled from each other.  Either way, some sort of quantitative analysis of the correlation between the different EEG channels might expose additional changes in brain patterns due to meditation.  I would find this kind of change to be very interesting.   I don't know what it would mean, but I would find it interesting.  So, I guess that I'm saying that I am not yet done with this particular set of EEG data.  I will pursue some kind of cross-channel analysis in my next post.

Until then, thanks for reading!

Follow-Up: Here is the analysis of the cross-channel coherence.  Cool!
Follow-Up: The raw data is available as part of the OpenBCI repository on GitHub

Monday, November 18, 2013

OpenBCI Alpha Wave Detector

Part of what excites me so much about EEG hacking is the idea that maybe I can control things with just my mind.  Once you gain any experience at all with EEG signals, however, you realize just how hard a task that can be.  So, start simple.  Start with what's easy.  Build from there.  With EEG, "easy" are Alpha waves.  Alpha waves is nice a simple EEG waveform that shows up fairly strongly around 10 Hz.  It is a great target for making one's first brain controlled hack.  And I just did it myself...check it out!  It's completely computer-free and feels like magic!


Electronics Setup

For this hack, I used the parts shown in the picture below.  It's an OpenBCI board sitting on an Arduino Uno (the Uno is completely hidden in this photo under the white OpenBCI board), a cheap peizo buzzer, and a basic red LED.  I put a 330 ohm resistor in series with the LED and in series with the buzzer to limit the current (a practice recommended in all of the Arduino learning examples).  Because I wanted to be completely computer-free, the whole thing is powered by a 9V battery adapter.

OpenBCI plus Arduino Uno plus LED, Piezo Buzzer, and 9V Battery.

EEG Setup

This hack uses two off-the-shelf reusable EEG electrodes.  I plug them into my Open BCI board using the adapter cable that I made.  I placed the first electrode (the reference) on the top of my head, a little towards the front ("Fz").  I placed the second electrode on the back of my head, just above the bump on the back of the head (the "inion") and a little to my left (aka "O1").  I worked the electrodes under my hair and stuck them in place using ten20 conductive paste.  This time, I used the small jar of it instead of the tube...the jar is much easier to work with.

My setup, including the colorful homemade adapter cable for
attaching my two EEG electrodes.
Arduino Processing Software

Unlike all of my previous experience with EEG hacking, where a PC was involved for doing the signal processing, today I will be doing all of the EEG processing on the Arduino itself.  The Arduino is not a computational power house, so we have to be reasonable in our expectations when doing signal processing on the Arduino.

To detect Alpha waves in EEG signals, there are several things that you need to do:

  1. Filter to remove strong interfering signals (60 Hz and DC drift)
  2. Filter to focus on the frequencies of interest (in this case, Alpha are ~10 Hz)
  3. Decide if there is enough Alpha (and just Alpha) to activate the LED and buzzer

The full details of my signal processing chain is a long story that will get its own post.  The Arduino's limited bit depth (32-bits is the maximum data type) and limited speed with floating point operations means that you cannot use sharp filters.  Instead, you have to use relatively gentle filters such as "biquad" filters (which are a form of 2nd order IIR filter).  To generate the filter coefficients, I used code that I found here.

After doing my filtering, I then compute the RMS power of the signal.  I simply square the single, apply a low-pass filter (another biquad from the code above), and take the square root.  This gives you a running RMS estimate of the signal amplitude.  Because of my filtering, this gives me a running estimate of the Alpha amplitude.  I then light my LED and sound my buzzer based on the amount of Alpha energy.

Thinking Things to Action

So, with this setup, you've got yourself a self-contained device that responds to your brain waves.  It doesn't have to be just an LED or buzzer, either.  It could be a robotic arm swinging a sword (to fight off pirates, of course), or a cool flashing hat for dance parties, or an animatronic flower that blooms with your thoughts.  Or maybe you like the idea of getting this kind of neurofeedback to see what is happening when you meditate (change the filter from 10 Hz Alpha up to 20 Hz Beta).  Or, maybe you could use it simply for weirding-out your friends and co-workers...what with the strange wires coming out of your head and all.  There are so many possibilities.

To me, controlling things with your brain in this way seems a bit magical...but I made this thing myself, so I know that it's not magic...it's hacking!

Follow-Up: A long time has passed, but I think that I found the code for this hack.  This was prompted by folks on the OpenBCI forum trying to do it themselves!  Cool!

Follow-Up:  I extended this work to control a six-legged robot with my brain waves!

Tuesday, November 12, 2013

Making an EEG Electrode Adapter

My earlier post on making my own EEG electrodes was surprisingly popular.  Thanks, all!  But, for some folks, it might just be easier to purchase EEG electrodes off the shelf.  If you buy your electrodes, they're likely to come with connectors on the ends.  In order to use these electrodes with an OpenBCI board, you'll need to either cut the connectors off, or you'll need to make an adapter cable.  Since I tend to play with a variety of electrodes (both EEG and ECG) and since many types of electrodes use this same connector, I thought that it would be good to make an adapter.  This post is about how I made my adapter cable.  Here's what it looks like when I was done.


Parts

To make the adapter cable, you need the connectors that mate to the EEG electrode, you need some wires, and you need some connectors that mate to the OpenBCI board.

The OpenBCI board simply uses pin headers with a 0.1" spacing.  Therefore, for "connectors", you can use any of the inexpensive jumper wires that are used throughout the hobby world for connecting to Arduino.  For this adapter cable, you need female pin headers.  Adafruit sells a fine pack of 40 female/female jumper wires (P/N 266) for $6.95.  The 40 wires come with the connectors already attached.  The wires also come attached to each other as a ribbon cable, which is very convenient for keeping the cables in order.

Female/Female Jumper Wires from Adafruit
For the EEG electrodes, they usually use "touchproof" connectors.  This are simple singe-conductor connectors where the metal part is completely shrouded in plastic.  They are fairly standardized, though the diameter of the connection can vary between 1mm and 2mm.  All of my electrodes are 1.5mm.  The jacks that mate to these electrodes can be purchased from Plastics One.  Specially, I chose to buy the panel mount, front-loaded, threaded connectors (P/N 36145) shown in the pictures below.  When bought in small numbers, they're $3.14 each.  That's pricey!

Jacks for Touchproof Connectors.  From Plastics One.
Assembly

The OpenBCI board has 11 connections that I might want to use.  So, I took the ribbon of 40 jumper wires and peeled off a single strip that contained 11 wires.  I then cut it in half to that one end had the female pin headers and the other end was just wire.


Then, I peeled apart the ends of the wire and stripped the ends.  As I prepared to solder on the touchproof jack, I slipped a piece of shrink tube over the end of the wire so that I could make it look nice when I was done.  I'm proud of myself for remembering to do the shrink tube.  I nearly always forget.  Not this time!

Preparing to solder the first jack.

After I soldered it on, I pulled the shrink tube up over the joint, applied some heat, and got a nice looking connection.

First jack is attached.  Nice use of shrink tube!
I then repeated the process for all the other wires that I was going to use.  Here's a picture of me soldering on the second jack.

Preparing to solder the second jack.
Completion

For my immediate testing, I did not need all 11 connections...I only needed four.  So, I only soldered on four jacks.  You can see my "completed" adapter cable assembly below.

My adapter cable with 4 connections.  I'll add the others when I need them.
Note that I added a piece of electrical tape around the ribbon cable to help keep it together.  I had overly separated one of the individual wires and it was threatening to come loose.  I little electrical tape saved the day!  And it makes it look fancy.

Using It

As you can tell by the photo at the top of this post, the adapter cable works great for interfacing OpenBCI to off-the-shelf electrodes.  I've used it with my EEG electrodes for follow-on measurements of my Mu-waves and with my ECG electrodes for checking my heart signals.  It's a great adapter cable to have in my EEG Hacker toolbox!


Tuesday, October 22, 2013

Finding My Mu Waves

I'm trying to control things with my brain.  As discussed in my previous post, I think that Mu waves are the best approach that I know about right now.  I tried to get my Mu waves before, but failed.  Now I'm trying again.  This time, I've done a little more learning, so I think that I know how to do it better.  Let's go!

Listening to My Brain
Approach:  The idea with a Mu wave brain-computer interface (BCI) is that I'll use my EEG system to listen to my brain waves.  Mu waves are simple but strong signals in the Alpha band that appear in the sensorimotor (SM) cortex when you relax parts of your body.  The Mu waves go away when you move (or *think* about moving!) those parts of your body.  Supposedly, different regions of the SM cortex correspond to different portions of your body.  So, with careful use of EEG, I might be able to separate thoughts of moving my legs from thoughts of moving my arms.  Seeing other folks do this on the web, this is pretty exciting stuff.

Goal:  My goal today is not to make a full Mu wave BCI.  That's too big a leap.  Today, I just want to see if I can pick up my Mu waves.

Equipment: To do this test, I need some EEG electrodes and an EEG system:

  • For the EEG electrodes, I'm using re-usable gold-plated cup electrodes from Biopac (EL160, see pic below).  This style of electrode is often used in hospitals and in research settings.  I'm using this style of electrode because I can easily slip them within my hair and stick them to the skin.  To use the electrodes, you need some electrode paste, which is both conductive and sticky.  I used Ten20 paste, also available from Biopac.  Just swab some paste into the electrode cup and stick it firmly onto your scalp, with as little hair as possible between the skin and the electrode.

Re-Usable Gold-Plated Electrodes from Biopac
  • For the EEG system, I'm using the OpenBCI system that I'm helping to develop.  This is an open source EEG system that mates to a microcontroller, such as an Arduino.  I'm using an Arduino Uno, which is simply pumping the EEG data from the OpenBCI board to a PC.  On the PC, I'm running some software to capture the data from the serial port.  I can view the data in real time, but really, I'm going to do most of the processing afterwards.
Using OpenBCI as My EEG System

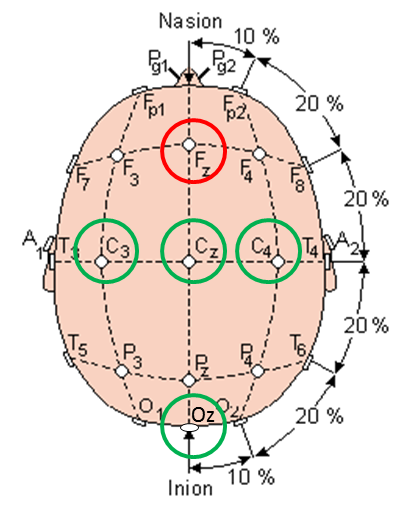
EEG Montage:  I think that a key challenge with measuring Mu waves is to get the electrodes in the right place.  They must be over the sensorimotor cortex or you're not going to see them.  How do you find the sensorimotor cortex?  Well, you have a good chance of getting it simply by drawing a line from the front of your ear (specifically, your tragion) up over the top of your head.  Really, though, you should follow the directions for finding EEG locations C3 or C4 according to the proper layout of the 10-20 system.  On my head, I put electrodes at C3 (left side), C4 (right size), Cz (top), and Oz (back).  I used Fz (front-top) as my reference electrode.  In the end, though I really only needed C3 and Oz along with the Fz reference.

Electrode Locations Used in My Testing
Another View Showing the Electrode Locations Used in My Testing

Test Plan:  So we need a test plan that will help me see Mu waves, which means that part of my test needs to have me be physically relaxed.  Then I need to make the Mu waves go away, which means that part of my test needs to have me move my body (I'll move my hand).  Actually, let's get fancy...I'm just going to *think* about moving my hand.  Finally, if I do see Mu waves, I need to make sure that I'm not just seeing alpha waves from the back of my head, so a third part of my test will be to close my eyes to induce my Posterior Dominant Rhythm, which are Alpha waves from the back of my head that expresses the idling of my visual cortex.  OK, I've got three parts of my test: relaxed, thinking about moving my hand, and relaxing but with my eyes closed.  I'm going to do this all while seated in a chair.

Data from the Oz, my Visual Cortex:  The data that I collected is messy.  This is true of most data that is ever collected from a living, breathing human being.  To help make sense of the data, I'm going to talk about the easier results first...and those are the results from the electrode at location Oz, on the back of my head.  The plot below is a spectrogram of the signal recorded at Oz.  Time is on the horizontal axis and signal frequency on the vertical axis.  A pixel's color indicates the intensity of the signal at that pixel's time and frequency.  The reason that I'm showing this plot first is because of the obviousness of the red horizontal lines that appear when my eyes are closed.  These red lines indicate strong sinusoidal signals around 9-10 Hz that are sustained when my eyes are closed.  Because it only occurs when my eyes are closed, this is certainly my Posterior Dominant Rhythm (PDR).  These are not Mu waves.  Therefore, moving forward, any signal that occurs at these times and these frequencies in my other electrodes will simply by this PDR being detected from afar.  Again, these are not Mu waves and can be ignored.

Horizontal Lines are my Posterior Dominant Rhythm
Data from the C3, my Sensorimotor Cortex:  Now that we know what to ignore, the plot below shows a spectrogram of the data from electrode C3, with is located over my SM cortex.  Probably the easiest thing to see (though it is generally messy all around) are weaker versions of the horizontal lines that appear when I close my eyes.  As discussed above, these are my PDR and should be ignored.  They are not Mu waves. What is more interesting in this plot are the faint horizontal lines a little higher in frequency (~12 Hz) that only seem to occur when I'm relaxed.  Note that, when I think about moving my hand, they go away.  These must be Mu waves!  I found them!

Some Mu Waves Are Occasionally Seen Around 12 Hz When Relaxed.

Plan for Live Feedback:  OK, so with this one test, I've shown that I can detect my Mu waves when I'm relaxed and that I can make them go away when I think about moving a body part.  That's pretty exciting. The signals are really weak, though.  It's hard to see them and it'll be hard to get the computer to detect them reliably.  Apparently, I'm not good at getting sufficiently relaxed.  My next step, therefore, is to generate some sort of live feedback based on the strength of my Mu waves.  I to do this, I will modify my PC software to process the data and make a dinging sound or something in proportion to the strength of the signal at 12 Hz.  This live feedback will tell my I'm doing the right thing.   As a result, I should be able to train myself to do a better job making Mu waves.

Plan for BCI:  Once I get better at making Mu waves, it will be easier for the computer to differentiate between my relaxed state (strong Mu waves) and my "thinking about my hand" state (no Mu waves).  Once the computer can differentiate between these two states, I will have my magical brain-controlled interface.  Moreover, since the brain is sided (left side vs right side), the computer should be able to tell the difference between thinking about the left hand versus thinking about the right hand.  With two controls (left and right) we can start doing more complex activities...like moving robot arms back and forth...or like changing the television channel up and down...or like driving a rover forward and back.

Yeah, this is gonna be cool...

Follow-Up: I recorded more Mu waves using some homemade electrodes
Follow-Up: I can now view my Mu waves using a real-time spectrogram in my Processing GUI

Sunday, October 13, 2013

EEG Hacking Begins

So you're interested in doing some EEG Hacking?  Me, too!  I've been doing EEG hacking for a few months now, and I'd like to share what I've learned.  I'm not quite sure where to begin, so I'll start with some of my favorite links on how I learned about EEG.  None of these links is entirely satisfying, so I'll eventually replace these links with my own content...but until I'm able to write it, we're stuck with what we find on the Internet.

A Sporty Blue EEG Cap 
Wikipedia:

Of course, everyone starts with the wikipedia page.  It's an OK page.  It's too long to be a good introduction.  I do find its discussion of the history of EEG to be interesting (it's 90 years old!) and I like the discussion of the different EEG frequency bands.  Sadly, it's not too helpful on how to actually do an EEG.
http://en.wikipedia.org/wiki/Electroencephalography


EEG Setup:

There's no good, simple description of how to do a very basic, hacker-style EEG.  I'm going to have to fix that.  Until that time, we're stuck with others' descriptions.

Here's a decent link that talks about a number of aspects of EEG, but I like the pictures of the electrodes, of the electrode placement, and of typical EEG artifacts...especially of eye motion.
http://www.medicine.mcgill.ca/physio/vlab/biomed_signals/eeg_n.htm

The BCI2000 folks also have a lot of good information.  Here's a basic on electrodes, placement, and typical signal artifacts.
http://www.bci2000.org/wiki/index.php/User_Tutorial:EEG_Measurement_Setup


Typical EEG Signals:

The links above talked about about some typical signals, especially of "artifacts", which are the undesirable signals that get picked up by the EEG system.  These artifacts are usually not associated with brain activity, which is why they are considered bad.

Actual brain signals in EEG are often discussed and analyzed based on their frequency content.  These are the so-called "Alpha waves", "Beta waves", "Theta waves", and such.  The Wikipedia page above discusses these different frequency band.  So does the link below:
http://emedicine.medscape.com/article/1139332-overview#aw2aab6b3

Another way of discussing EEG signals is by the shape of the waves, not just their frequency content.  This is the "morphology" of the waves.  These are the "Sleep Spindles" and "K Complexes".  Some of the morphologic features in EEG signals:
http://emedicine.medscape.com/article/1139332-overview#aw2aab6b3

Finally, here's a more formal (and detailed!) discussion of some normal types of signals that you might see in an EEG.  It spends a lot of time discussing alpha waves.
http://www.ccs.fau.edu/~bressler/EDU/NSP/References/Niedermeyer_1999.pdf